DotEarth Post
In Andy Revkin's recent DotEarth column about James Hansen's New York Times Op-Ed piece, he quoted two scientists who seemed to cast doubt on Dr. Hansen's statements about climate change and the need to begin reducing carbon dioxide emissions immediately.
I helped Jim edit his piece and I also assisted him by providing references to the New York Times fact checker.
Martin Hoelring is quoted in the DotEarth column disputing Jim's claim that "The global warming signal is now louder than the noise of random weather". Martin stated "The variability of daily temperature over the U.S. is much larger than the anthropogenic warming signal at the time scales of local weather." The time scales of local weather are hourly to daily, but no one is looking for the global warming signal on that time scale, so I'm not quite sure why Martin even mentions that. Weather and climate are different. "Weather is what you get, climate is what you expect" and what we expect is a warmer world. It is quite straightforward to detect the global warming signal from the noise of local weather over climate times scales (decades). Many studies, including one partially funded by the Koch brothers, have determined that the global mean temperature has increased by about 1.4°F (0.8°C) since the industrial revolution. The Intergovernmental Panel on Climate Change (IPCC) has stated that warming is "unequivocal" using many lines of evidence. Dr. Hansen's own work, described below, shows the global warming signal clearly growing in the last few decades.
Martin also seems to dispute Jim's claim that projections point to semi-permanent drought conditions in the Western United States and the semi-arid region from North Dakota to Texas in the coming decades. Martin says "I am unaware of indications, from model projections, for a material decline in mean rainfall. Indeed, that region has seen a general increase in rainfall over the long term during most seasons (certainly no material decline)." First of all, while Martin may indeed be unaware of studies showing predictions of drought in the U.S. in the coming decades, it is certainly not because they don't exist. I provided references to the New York Times including a study by Aiguo Dai of the National Center for Atmospheric Research. The press release that accompanied the study was titled "Climate Change: Drought May Threaten Much of Globe Within Decades". Quoting from the press release: "By the 2030s, the results indicated that some regions in the United States and overseas could experience particularly severe conditions, with average decadal readings potentially dropping to -4 to -6 in much of the central and western United States as well as several regions overseas, and -8 or lower in parts of the Mediterranean." I should note that for the Palmer drought index they are using, a reading of -3 is associated with the Dust Bowl of the 1930s. Joe Romm at Climate Progress has an in-depth piece on why Martin's statements about drought predictions are incorrect.
Martin also disputes Jim's claim that there is a high probability that the recent Texas and Russian heat waves were not natural events and were indeed caused by global warming.
For insight into both the global warming signal and heat wave issues, I suggest taking a look at Jim Hansen's recent "Climate Dice" paper (it has already been peer-reviewed and will be published soon). It is quite remarkable. No models. No predictions. It is simply a statistical analysis of measured temperatures from 1951 to 2011. Here is the key graph:
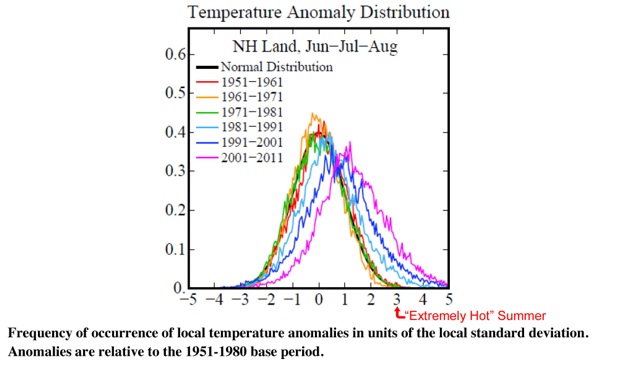
The vertical scale is probability and the horizontal scale is temperature in units of "standard deviations". While specific temperatures are location dependent (e.g., Anchorage vs. Miami), you can think of +1 standard deviation (or "1-sigma") as being a "Hot" summer, +2-sigma being a "Very Hot" summer, and +3-sigma being an "Extremely Hot" summer (I inserted that notation on the graph). Note that this is not based on models, etc. It's simply looking at the measured temperature data and doing basic statistical analysis. Now you can see that the curves from the 1950's, 1960's and 1970's pretty much follow a "normal distribution". When you look at the 1950's-1970's "+3-sigma" temperature, its probability of occurring is very low (about one-quater of one percent). As global warming kicks in, the average temperature (effectively the peak of the curve) shifts to the right (warmer) somewhat -- about one standard deviation. But because of the shift caused by global warming, the extremes (more specifically, the area under the curve that is +3-sigma or beyond) grows dramatically. What this shows is that the probability of an extreme heat wave has increased enormously… by about 40 times (4000%) in the last 50 years.
The shift of the curve is exactly the "signal" you would expect with global warming and it is clear and dramatic. See the IPCC SREX Report (Page 5) for more on temperature distributions curves under global warming.
The fact that 3-sigma "Extremely Hot" summers have increased in probability from around 0.25% to around 10% in 50 years tells you that if you now have a 3-sigma heat event, then you can say with high confidence that it is most likely caused by the shift of the temperature distribution curve, in other words, by global warming. Again, this is not based on models or predictions, just on a straightforward statistical analysis of measured temperature data. You should also note that +4 and +5-sigma events, that almost never occurred in the past, are now occurring with a noticeable frequency and these formerly 1-in-10,000 events will occur with even more frequency in the future.
People wonder how a mere +0.8°C or even +2°C warming can cause big problems. While the average temperature increase may not seem that bad (well, unless you don't mind the melting of glaciers and ice sheets), the multi-thousand percent increase in extreme events will certainly get everyone's attention and will cause (and already has caused) incredible damage and economic harm.
So, Jim's claims that the global warming signal is now bigger than the noise of natural weather fluctuation and that recent 3-sigma heat waves can be attributed to global warming both are supported by temperature measurements over the past 60 years.
Climate scientist Kerry Emanuel also weighed in on Jim's Op-Ed. He said "I see overstatement on all sides" (referring to Martin and Jim). I wanted to know what Kerry's specific concerns were about Dr. Hansen's Op Ed, so I wrote to him. He responded that he is in agreement with Dr. Hansen's main points, though he feels that Jim should not have stated his case with such confidence. There is no certainty in science (the strongest level of scientific confidence is called a "theory") and Jim did not remind people that risk, by its very nature, entails uncertainty. Kerry also said that he agrees with Jim's main conclusion that we need to begin reducing greenhouse gas emissions now.
So, contrary to the impression that readers of DotEarth may have gotten from the post about Dr. Hansen's Op-Ed, (1) there are projections of drought in the U.S. in the coming decades, (2) the global warming "signal" can clearly be detected over the noise of natural weather variations, and (3) studies of measured temperature data provide clear evidence that the recent 3-sigma extreme Texas and Russian heat waves were, with high probability, caused by global warming.
Without a doubt, it is time to begin reducing our greenhouse gas emissions.
Response to Criticisms of Jim Hansen’s NY Times Op-Ed